最近工作中改了不少core,对segment fault有了一些肤浅的认识,本篇文章会试图总结常见的原因,使用非常浅显的汇编知识加以印证,有多浅显呢? 今天早上刚刚学完这篇文章汇编语言入门教程。文章标题虽然从分析segment fault写起,但仍然会延续想到哪写到哪的风格,如果对文章有任何疑问,欢迎留言讨论。
段错误产生的种类
总结几种原因,这里划分可能不科学,这里的划分可能有重叠,比如1 2是8栈溢出的一种形式。
1.数组(vector)越界
2.使用strcpy strcat 等不安全的字符串操作函数
3.多线程访问全局变量未加锁
4.多线程使用线程不安全函数
5.信号处理函数中使用信号不安全函数
6.使用非法指针,如空指针
7.内存释放后未置空,导致踩内存
8.堆栈溢出
前面6种相对比较常见,第7种踩内存目前以我的水平难以从反汇编后的代码分析,只能采取一种保守的方法。踩内存产生的一个原因是流程A中释放内存后,未将指针置为NULL,导致后续流程使用该指针,那么一种排查问题的方法是养成良好的编程习惯,释放后置为NULL。
#define SAFE_FREE(p) if(p != NULL) {free(p); p = NULL;}
不喜欢宏的形式的话可以使用
if(p)
{
    free(p);
    p = NULL;
}
我们这样修改代码后,然后再复现问题,复现后就能知道出问题的流程,分析这里为什么在资源释放后对空指针进行操作,然后根据core信息定位问题。
本篇文章我们重点介绍栈溢出,然后围绕栈溢出,介绍栈溢出前介绍寄存器与函数调用的关系。并结合实例使用gdb分析,验证汇编语言部分的正确性。
调试时必须的栈知识
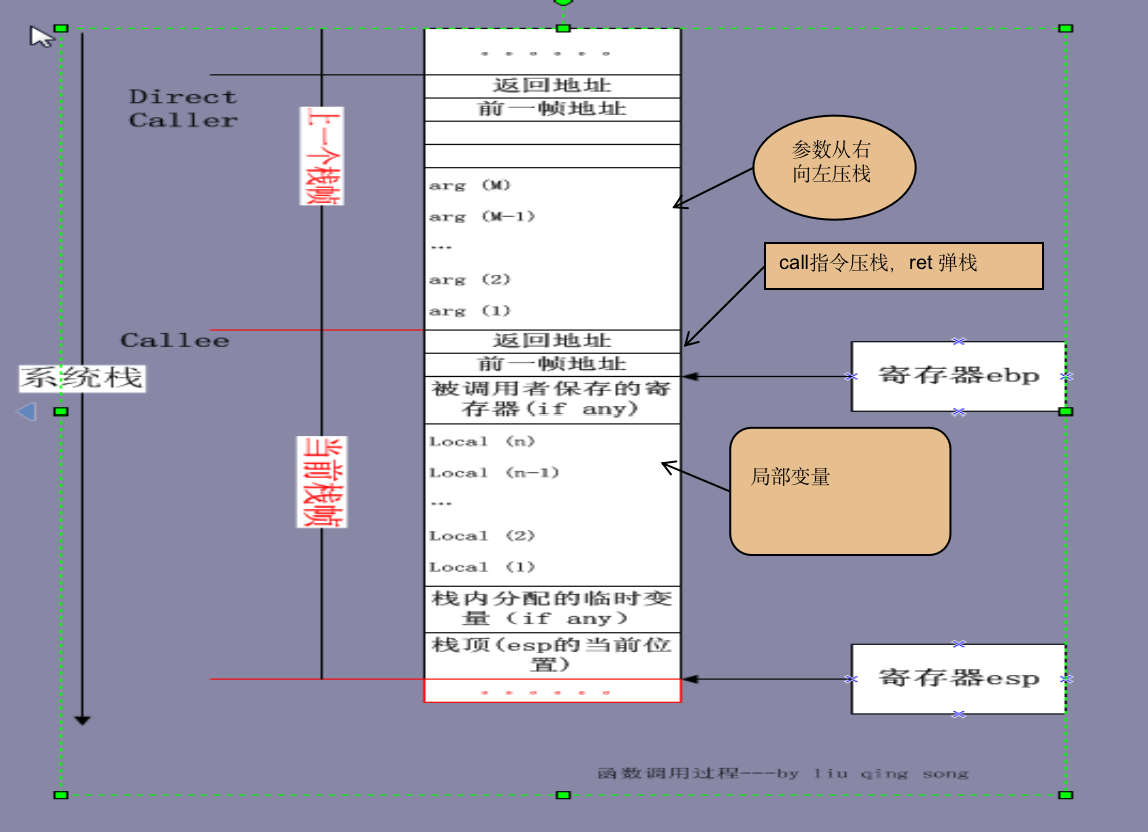
栈(stack)是程序存放数据的内存区域之一,其特征是LIFO(Last In First Out,后进先出)式数据结构,即后放进的数据最先被取出。向栈中存储数据的操作称为PUSH(压入),从栈中取出数据称为POP(弹出)。在保存自动变量时要使用栈。此外在函数调用时,栈还用于传递函数参数,以及用于保存返回地址和返回值。
栈由上到下,地址是由高到低。以函数B调用函数C为例,B调用C前,先把C的参数从右到左一个一个压入栈中,然后再把上一级函数调用时的rip(eip),rbp(ebp)压入栈,然后就是把C中的局部变量从最后一个变量到第一个变量依次压栈。
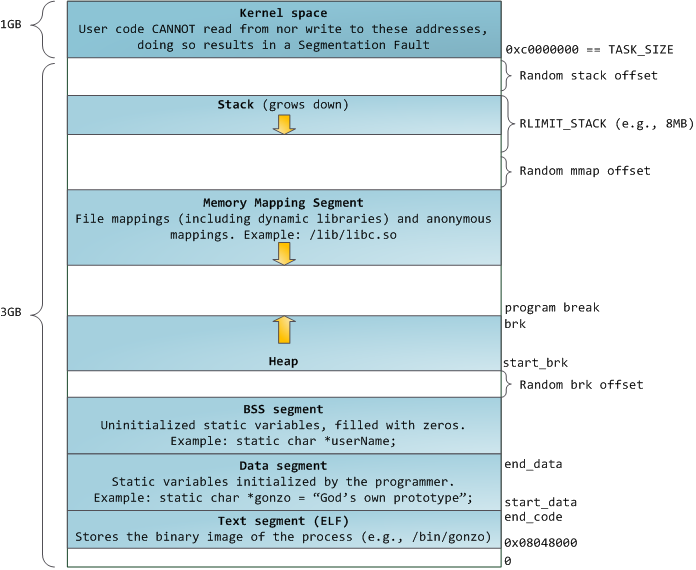
首先我们验证上面两张图中隐含的一个结论:
栈向下增加(高地址到低地址),堆向上增长(低地址到高地址)程序如下
#include <stdio.h>
#include <stdlib.h>

int sum(int i,int j)
{
    printf(" i = %p\n j = %p\n",&i,&j);
    return 0;
}

int foo(int a)
{
    int b = 10;
    int c = 20;
    printf(" a = %p\n b = %p\n c = %p\n",
        &a , &b , &c);
    sum(b,c);
    return 0;
}


int main()
{
    int *p = (int *)malloc(sizeof(int));
    *p = 10;

    int *q = (int *)malloc(sizeof(int));
    *q = 20;

    foo(*p);

    printf(" p = %p\n q = %p\n",p,q);

    return 0;
}
一个可能的输出是:
[root c++]#./a.out
 a = 0x7ffda4a68b1c
 b = 0x7ffda4a68b20
 c = 0x7ffda4a68b24
 i = 0x7ffda4a68afc
 j = 0x7ffda4a68af8
 p = 0x55a96d16a260
 q = 0x55a96d16a280
这个例子中验证方法是函数foo调用函数sum,函数foo内的局部变量等先入栈,然后函数sum中的局部变量等后入栈,我们可以看到变量a b c 的地址比 i j地址大,验证了栈的增长方向是从高地址到地址。而堆上的地址q比p大,验证了堆增长方向向上(低地址到高地址)
x86_64下的调用
搜到的资料都是分析的32位环境下汇编语言与c函数参数对应的关系,通过例子我猜测在X86_64中参数会依次保存到rdi,rsi,rdx,rcx,r8,r9中。
程序如下:
#include <stdio.h>

int f(int a,int b,int c,int d,int e,int f)
{
    return 0;
}

int main()
{
    f(1,2,3,4,5,6);
    return 0;
}
通过gdb验证函数参数保存顺序方法:
[root func]#gdb a.out
GNU gdb (Ubuntu 8.1-0ubuntu3.2) 8.1.0.20180409-git
Copyright (C) 2018 Free Software Foundation, Inc.
License GPLv3+: GNU GPL version 3 or later <http://gnu.org/licenses/gpl.html>
This is free software: you are free to change and redistribute it.
There is NO WARRANTY, to the extent permitted by law.  Type "show copying"
and "show warranty" for details.
This GDB was configured as "x86_64-linux-gnu".
Type "show configuration" for configuration details.
For bug reporting instructions, please see:
<http://www.gnu.org/software/gdb/bugs/>.
Find the GDB manual and other documentation resources online at:
<http://www.gnu.org/software/gdb/documentation/>.
For help, type "help".
Type "apropos word" to search for commands related to "word"...
Reading symbols from a.out...(no debugging symbols found)...done.
(gdb) b f
Breakpoint 1 at 0x5fe
(gdb) r
Starting program: /root/workspace/c++/func/a.out

Breakpoint 1, 0x00005555555545fe in f ()
(gdb) info register
rax            0x555555554619   93824992232985
rbx            0x0  0
rcx            0x4  4
rdx            0x3  3
rsi            0x2  2
rdi            0x1  1
rbp            0x7fffffffe390   0x7fffffffe390
rsp            0x7fffffffe390   0x7fffffffe390
r8             0x5  5
r9             0x6  6
r10            0x0  0
r11            0x1  1
r12            0x5555555544f0   93824992232688
r13            0x7fffffffe480   140737488348288
r14            0x0  0
r15            0x0  0
rip            0x5555555545fe   0x5555555545fe <f+4>
eflags         0x246    [ PF ZF IF ]
cs             0x33 51
ss             0x2b 43
ds             0x0  0
es             0x0  0
fs             0x0  0
gs             0x0  0
(gdb) bt
#0  0x00005555555545fe in f ()
#1  0x0000555555554642 in main ()
(gdb) info frame 0
Stack frame at 0x7fffffffe3a0:
 rip = 0x5555555545fe in f; saved rip = 0x555555554642
 called by frame at 0x7fffffffe3b0
 Arglist at 0x7fffffffe390, args:
 Locals at 0x7fffffffe390, Previous frame's sp is 0x7fffffffe3a0
 Saved registers:
  rbp at 0x7fffffffe390, rip at 0x7fffffffe398
这里我们可以反汇编看对应的信息如下:
(gdb) disas f
Dump of assembler code for function f:
   0x00005555555545fa <+0>: push   %rbp
   0x00005555555545fb <+1>: mov    %rsp,%rbp
=> 0x00005555555545fe <+4>: mov    %edi,-0x4(%rbp)
   0x0000555555554601 <+7>: mov    %esi,-0x8(%rbp)
   0x0000555555554604 <+10>:    mov    %edx,-0xc(%rbp)
   0x0000555555554607 <+13>:    mov    %ecx,-0x10(%rbp)
   0x000055555555460a <+16>:    mov    %r8d,-0x14(%rbp)
   0x000055555555460e <+20>:    mov    %r9d,-0x18(%rbp)
   0x0000555555554612 <+24>:    mov    $0x0,%eax
   0x0000555555554617 <+29>:    pop    %rbp
   0x0000555555554618 <+30>:    retq
End of assembler dump.
语法形式:
mov %edi,-0x4(%rbp)
这里的意思是将edi里保存的值保存到rbp栈指针下移4的位置。
我们看到函数参数依次保存到寄存器rdi rsi rdx rcx r8 r9中,通过反汇编后的代码我们可以看到会将参数依次存入栈指针rbp指向的位置,每次插入前rbp先指向下一个位置.
实例分析
网上看到一张图,虽然是32bit栈帧结构,64bit栈帧结构大致相同,只是在调用参数、局部变量寄存器的使用多一些。
#include <stdio.h>
#include <unistd.h>
#include <stdlib.h>
void test_lock(const char *path)
{
    int ret = -1;
    int fd = -1;

    if(path == NULL)
    {
        printf("Hello,world.\n");
    }

    while(1)
    {
        sleep(1);
    }
}

int main(int argc,char *argv[])
{
    test_lock(argv[1]);

    return 0;
}
[root assemb]#gdb stack
GNU gdb (Ubuntu 8.1-0ubuntu3.2) 8.1.0.20180409-git
Copyright (C) 2018 Free Software Foundation, Inc.
License GPLv3+: GNU GPL version 3 or later <http://gnu.org/licenses/gpl.html>
This is free software: you are free to change and redistribute it.
There is NO WARRANTY, to the extent permitted by law. Type "show copying"
and "show warranty" for details.
This GDB was configured as "x86_64-linux-gnu".
Type "show configuration" for configuration details.
For bug reporting instructions, please see:
<http://www.gnu.org/software/gdb/bugs/>.
Find the GDB manual and other documentation resources online at:
<http://www.gnu.org/software/gdb/documentation/>.
For help, type "help".
Type "apropos word" to search for commands related to "word"...
Reading symbols from stack...done.
(gdb) b test_lock
Breakpoint 1 at 0x696: file stack.c, line 6.
(gdb) r my_test
Starting program: /root/workspace/c++/func/assemb/stack my_test
Breakpoint 1, test_lock (path=0x7fffffffe6e6 "my_test") at stack.c:6
6 int ret = -1;
//这里我们可以验证rdi中保存了第一个参数
(gdb) p/x path
$1 = 0x7fffffffe6e6
(gdb) p/x $rdi
$2 = 0x7fffffffe6e6
//这里我们结合上面的图验证前一帧的地址刚好在rbp的上面(+0x8,栈从上到下,地址由高到低)
(gdb) x $rbp + 0x8
0x7fffffffe368: 0x555546e5
(gdb) bt
#0 test_lock (path=0x7fffffffe6e6 "my_test") at stack.c:6
#1 0x00005555555546e5 in main (argc=2, argv=0x7fffffffe468) at stack.c:22
(gdb) disassemble
Dump of assembler code for function test_lock:
0x000055555555468a <+0>: push %rbp
0x000055555555468b <+1>: mov %rsp,%rbp
0x000055555555468e <+4>: sub $0x20,%rsp
0x0000555555554692 <+8>: mov %rdi,-0x18(%rbp)
=> 0x0000555555554696 <+12>: movl $0xffffffff,-0x8(%rbp)
0x000055555555469d <+19>: movl $0xffffffff,-0x4(%rbp)
0x00005555555546a4 <+26>: cmpq $0x0,-0x18(%rbp)
0x00005555555546a9 <+31>: jne 0x5555555546b7 <test_lock+45>
0x00005555555546ab <+33>: lea 0xc2(%rip),%rdi # 0x555555554774
0x00005555555546b2 <+40>: callq 0x555555554550 <puts@plt>
0x00005555555546b7 <+45>: mov $0x1,%edi
0x00005555555546bc <+50>: callq 0x555555554560 <sleep@plt>
0x00005555555546c1 <+55>: jmp 0x5555555546b7 <test_lock+45>
End of assembler dump.
//这里我们通过打印ret fd path变量的地址与rbp的关系,结合上面的图可以得到结论如下:
//先声明的变量后入栈,fd与rbp间隔4,ret间隔8,path间隔18
(gdb) p/x $rbp - (void *)&ret
$3 = 0x8
(gdb) p/x $rbp - (void *)&fd
$4 = 0x4
(gdb) p/x $rbp - (void *)&path
$5 = 0x18gdb的基本使用
介绍gdb中一些与寄存器 栈帧相关的内容。
显示栈帧
backtrace命令可以在遇到断点而暂停执行时显示栈帧。该命令简写为bt,使用backtrace N 可以只显示开头N个栈帧,使用backtrace -N只显示最后N个栈帧
这里有个比较有用的技巧是bt full N,不仅显示backtrace,还要显示局部变量,程序编译时需要添加-g选项,否则不会显示局部变量。
(gdb) bt
#0  sum (i=10, j=20) at convert.c:6
#1  0x0000555555554782 in foo (a=10) at convert.c:16
#2  0x00005555555547e2 in main () at convert.c:29
(gdb) bt full
#0  sum (i=10, j=20) at convert.c:6
No locals.
#1  0x0000555555554782 in foo (a=10) at convert.c:16
        b = 10
        c = 20
#2  0x00005555555547e2 in main () at convert.c:29
        p = 0x555555756260
        q = 0x555555756280
显示寄存器
info registers可以显示寄存器,简写为info reg。
(gdb) info reg
rax            0xa  10
rbx            0x0  0
rcx            0x0  0
rdx            0x14 20
rsi            0x14 20
rdi            0xa  10
rbp            0x7fffffffe3a0   0x7fffffffe3a0
rsp            0x7fffffffe390   0x7fffffffe390
r8             0x0  0
r9             0x0  0
r10            0x0  0
r11            0x246    582
r12            0x5555555545f0   93824992232944
r13            0x7fffffffe480   140737488348288
r14            0x0  0
r15            0x0  0
rip            0x5555555547e2   0x5555555547e2 <main+69>
eflags         0x202    [ IF ]
cs             0x33 51
ss             0x2b 43
ds             0x0  0
es             0x0  0
fs             0x0  0
gs             0x0  0
在寄存器名之前添加$,即可显示各个寄存器的内容。
(gdb) p $rdx
$1 = 20
程序计数器可以写为$pc,64位机器下$rip与$pc相同
(gdb) p $pc
$18 = (void (*)()) 0x555555554708 <sum+14>
(gdb) p $rip
$19 = (void (*)()) 0x555555554708 <sum+14>
x命令
x命令可以显示内存的内容:
x/格式 地址
(gdb) x $pc
=> 0x555555554708 <sum+14>: lea    -0x8(%rbp),%rdx
此处x/i意为显示汇编指令
(gdb) x/i $pc
=> 0x555555554708 <sum+14>: lea    -0x8(%rbp),%rdx
一般使用x命令时,格式为x/NFU ADDR,此处ADDR为希望显示的地址,N为重复次数,F为(x(16进制),d(10进制),u(无符号10进制),o(8进制),t(二进制),a(地址),c(字符),f(浮点小树),s(字符串),i(显示为机器语言)),U为(b(字节),h(半字2字节),w(字4字节),g(双字8字节))
(gdb) x/10 $pc
=> 0x555555554708 <sum+14>: lea    -0x8(%rbp),%rdx
   0x55555555470c <sum+18>: lea    -0x4(%rbp),%rax
   0x555555554710 <sum+22>: mov    %rax,%rsi
   0x555555554713 <sum+25>: lea    0x17a(%rip),%rdi        # 0x555555554894
   0x55555555471a <sum+32>: mov    $0x0,%eax
   0x55555555471f <sum+37>: callq  0x5555555545c0 <printf@plt>
   0x555555554724 <sum+42>: mov    $0x0,%eax
   0x555555554729 <sum+47>: leaveq
   0x55555555472a <sum+48>: retq
   0x55555555472b <foo>:    push   %rbp
反汇编
反汇编当前整个函数
(gdb) disass main
Dump of assembler code for function main:
   0x000055555555479d <+0>: push   %rbp
   0x000055555555479e <+1>: mov    %rsp,%rbp
   0x00005555555547a1 <+4>: sub    $0x10,%rsp
=> 0x00005555555547a5 <+8>: mov    $0x4,%edi
   0x00005555555547aa <+13>:    callq  0x5555555545d0 <malloc@plt>
   0x00005555555547af <+18>:    mov    %rax,-0x10(%rbp)
   0x00005555555547b3 <+22>:    mov    -0x10(%rbp),%rax
   0x00005555555547b7 <+26>:    movl   $0xa,(%rax)
   0x00005555555547bd <+32>:    mov    $0x4,%edi
   0x00005555555547c2 <+37>:    callq  0x5555555545d0 <malloc@plt>
   0x00005555555547c7 <+42>:    mov    %rax,-0x8(%rbp)
   0x00005555555547cb <+46>:    mov    -0x8(%rbp),%rax
   0x00005555555547cf <+50>:    movl   $0x14,(%rax)
   0x00005555555547d5 <+56>:    mov    -0x10(%rbp),%rax
   0x00005555555547d9 <+60>:    mov    (%rax),%eax
   0x00005555555547db <+62>:    mov    %eax,%edi
   0x00005555555547dd <+64>:    callq  0x55555555472b <foo>
   0x00005555555547e2 <+69>:    mov    -0x8(%rbp),%rdx
   0x00005555555547e6 <+73>:    mov    -0x10(%rbp),%rax
   0x00005555555547ea <+77>:    mov    %rax,%rsi
   0x00005555555547ed <+80>:    lea    0xca(%rip),%rdi        # 0x5555555548be
   0x00005555555547f4 <+87>:    mov    $0x0,%eax
   0x00005555555547f9 <+92>:    callq  0x5555555545c0 <printf@plt>
   0x00005555555547fe <+97>:    mov    $0x0,%eax
   0x0000555555554803 <+102>:   leaveq
   0x0000555555554804 <+103>:   retq
End of assembler dump.
反汇编程序计数器所在的整个函数
(gdb) disassem  $pc
Dump of assembler code for function main:
   0x000055555555479d <+0>: push   %rbp
   0x000055555555479e <+1>: mov    %rsp,%rbp
   0x00005555555547a1 <+4>: sub    $0x10,%rsp
=> 0x00005555555547a5 <+8>: mov    $0x4,%edi
   0x00005555555547aa <+13>:    callq  0x5555555545d0 <malloc@plt>
   0x00005555555547af <+18>:    mov    %rax,-0x10(%rbp)
   0x00005555555547b3 <+22>:    mov    -0x10(%rbp),%rax
   0x00005555555547b7 <+26>:    movl   $0xa,(%rax)
   0x00005555555547bd <+32>:    mov    $0x4,%edi
   0x00005555555547c2 <+37>:    callq  0x5555555545d0 <malloc@plt>
   0x00005555555547c7 <+42>:    mov    %rax,-0x8(%rbp)
   0x00005555555547cb <+46>:    mov    -0x8(%rbp),%rax
   0x00005555555547cf <+50>:    movl   $0x14,(%rax)
   0x00005555555547d5 <+56>:    mov    -0x10(%rbp),%rax
   0x00005555555547d9 <+60>:    mov    (%rax),%eax
   0x00005555555547db <+62>:    mov    %eax,%edi
   0x00005555555547dd <+64>:    callq  0x55555555472b <foo>
   0x00005555555547e2 <+69>:    mov    -0x8(%rbp),%rdx
   0x00005555555547e6 <+73>:    mov    -0x10(%rbp),%rax
   0x00005555555547ea <+77>:    mov    %rax,%rsi
   0x00005555555547ed <+80>:    lea    0xca(%rip),%rdi        # 0x5555555548be
   0x00005555555547f4 <+87>:    mov    $0x0,%eax
   0x00005555555547f9 <+92>:    callq  0x5555555545c0 <printf@plt>
   0x00005555555547fe <+97>:    mov    $0x0,%eax
   0x0000555555554803 <+102>:   leaveq
   0x0000555555554804 <+103>:   retq
End of assembler dump.
改变变量的值
#include <unistd.h>
#include <stdio.h>

int main()
{
    int i = 0;
    if(1==i)
    {
        printf("hello,world");
    }
    return 0;
}
在gdb中另一个有用的技巧是改变变量的值,满足某些逻辑执行条件,验证代码执行是否正确。
Breakpoint 1, main () at hello.c:6
6       int i = 0;
(gdb) p i
$1 = 0
(gdb) n
7       if(1==i)
(gdb) p i
$2 = 0
(gdb) set variable i=1
(gdb) p i
$3 = 1
(gdb) n
9       printf("hello,world");
(gdb) n
11      return 0;
生成内核转储文件
在gdb中使用generate-core-file,在命令行直接输入gcore pid就可以直接生成内核转储文件。
断点命令commands
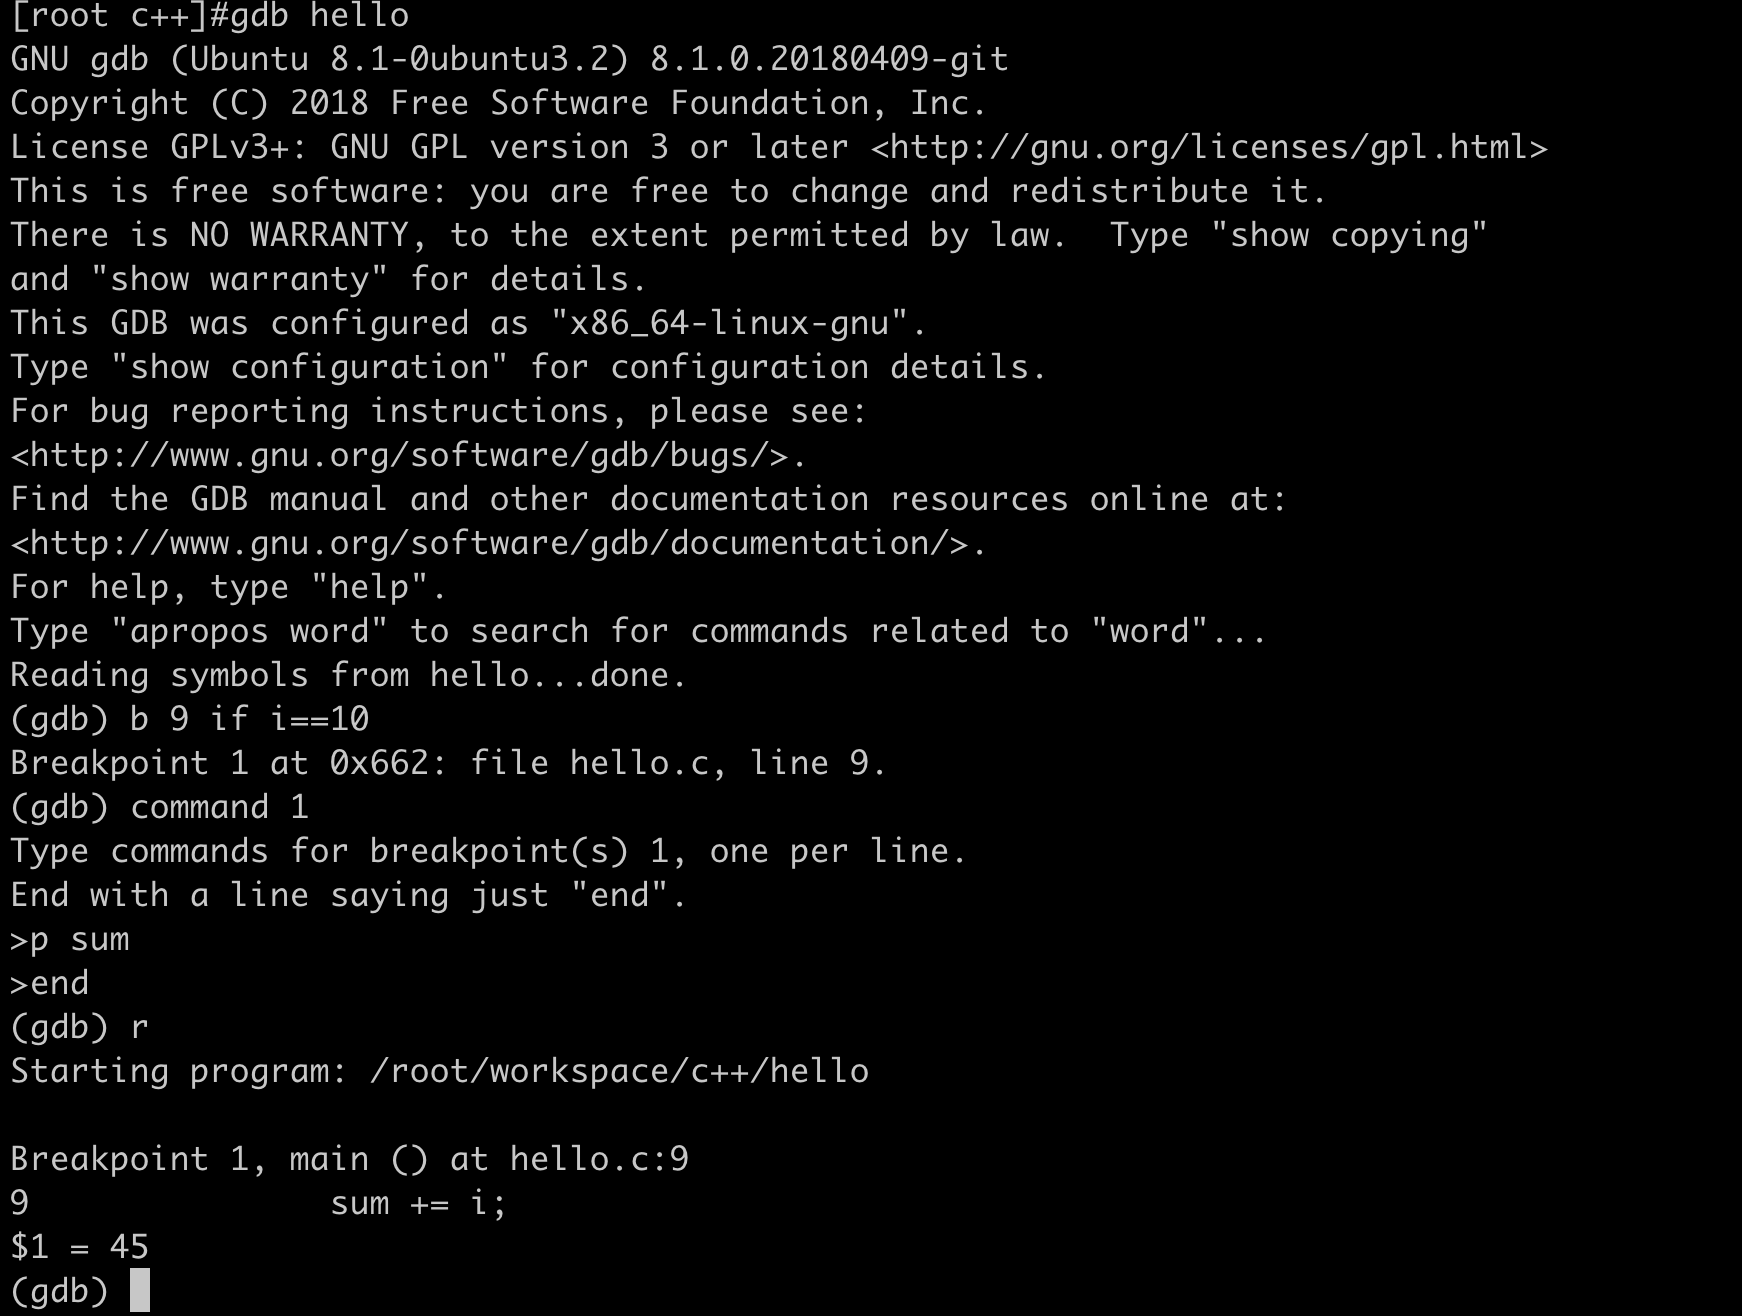
这里我们可以使用commands命令,定义在断点中断后自动执行的命令。
这里可以和条件断点组合使用,在断点暂停时执行复杂的显示动作等。
break foo if x>0
commands
  silent
  printf "x is %d\n",x
  cont
end
定义命令
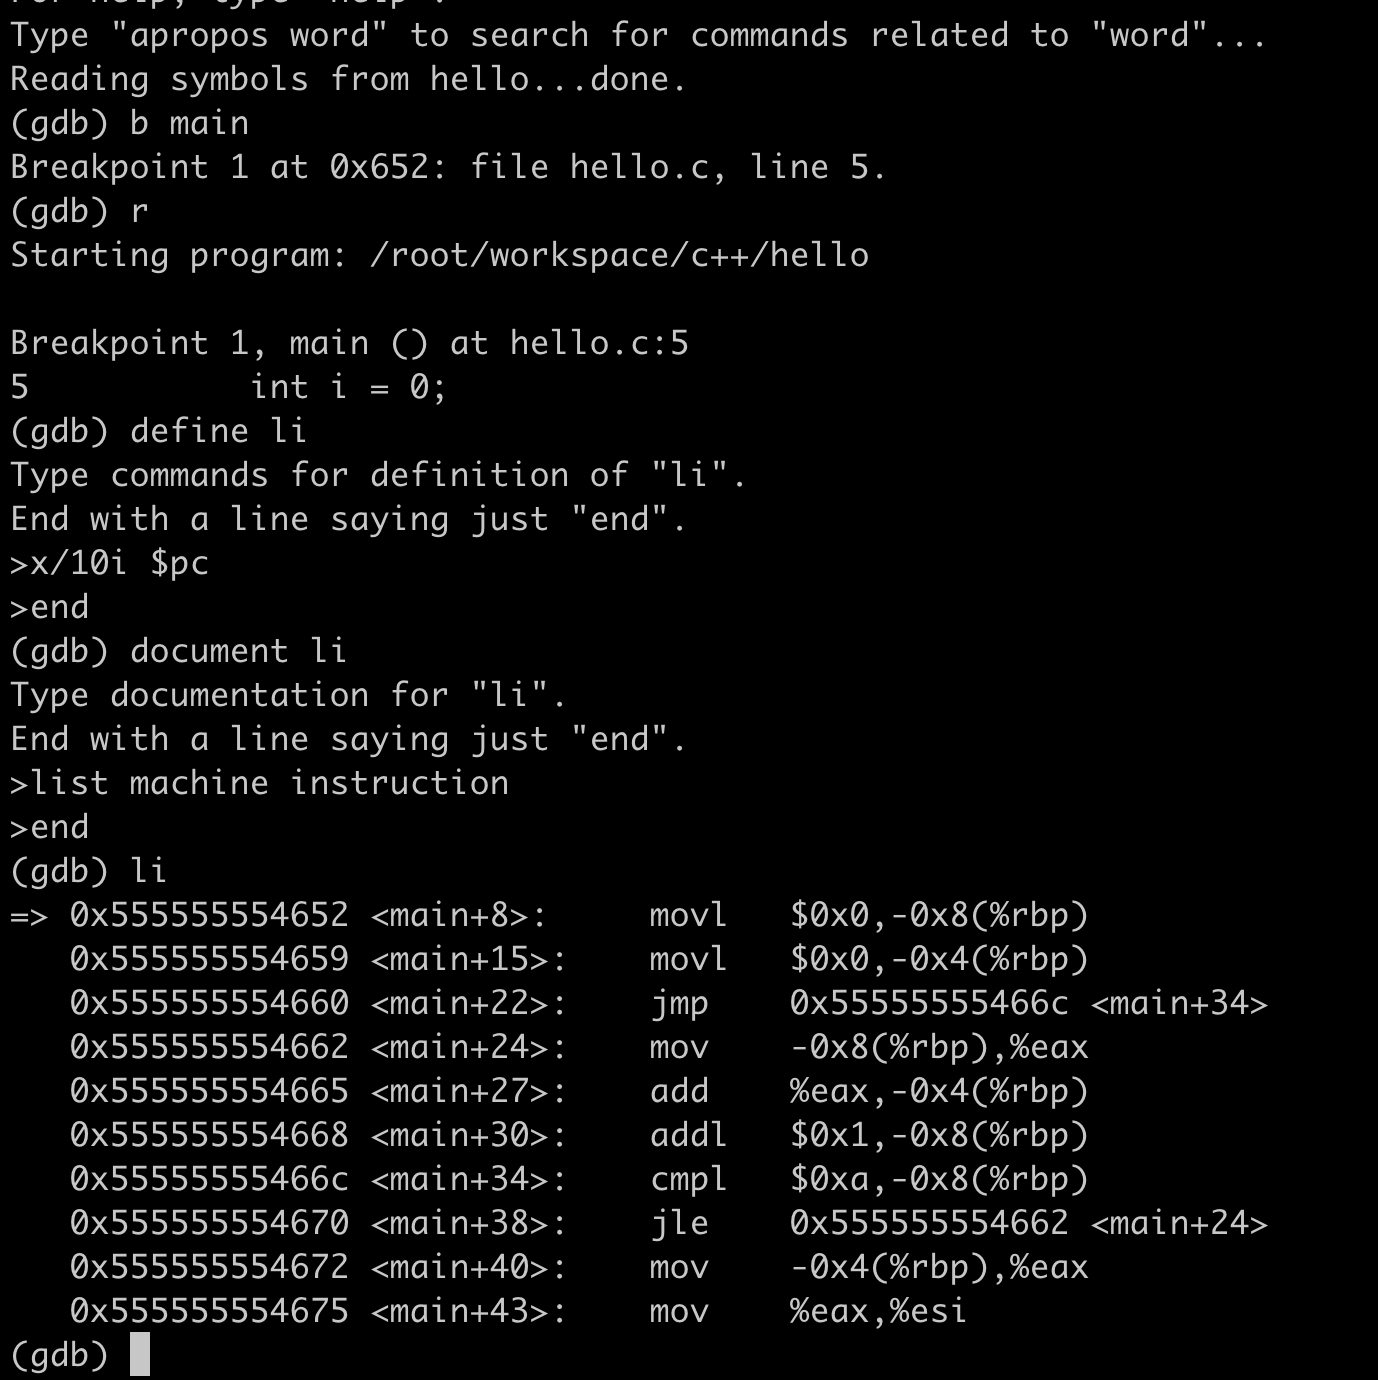
参考文章: